You open an annual report looking for a clear picture of the year. A few pages in, every paragraph seems equally important. The figures are there, but the comparisons take work. The photography looks good, although it tells you very little about the business.
This is where report design earns its place. The layout, charts and imagery determine what readers notice first, how easily they find their way around and whether they understand what the information means.
For teams preparing annual, management or sustainability reports, those decisions deserve attention early in the process. They shape how effectively the report communicates.
Give the reader a way into the page
Readers arrive with different questions. An investor may be looking for performance against strategy. An employee may want to understand the direction of the business. A stakeholder may go straight to a particular project or sustainability measure.
A clear visual hierarchy helps each of them find a starting point. Headings explain the subject. A carefully selected figure draws attention to an important result. Supporting text supplies the context, while consistent navigation helps readers move between sections.
The choices can be quiet. More space around a chart, a stronger heading or a shorter line of text can make a dense page easier to approach. When everything competes for attention, readers have to decide for themselves where to begin.
Choose graphics that explain the information
A useful graphic begins with a question. Are we showing change over time, comparing performance across regions or explaining how a process works? The answer should guide the format.
A line chart can reveal a trend. Bars make comparisons easier to judge. A diagram can explain a process that would otherwise take several paragraphs. Some information still belongs in a table, particularly when readers need to check exact values.
Context matters as much as the format. A large percentage needs a period and a comparison. Charts need clear labels, consistent units and scales that represent the data fairly. Readers should be able to understand the point without searching elsewhere for an explanation.
For DEWA’s management reports, we standardised graphs, diagrams and visuals across a complex portfolio of companies. That consistency helped organise detailed information into a report stakeholders could work through more easily.
Use imagery to support the story
Photography gives a report a sense of the organisation behind the figures. It can show the people delivering a service, the environment a business operates in or the detail of a completed project. The choice should follow the subject of the page.
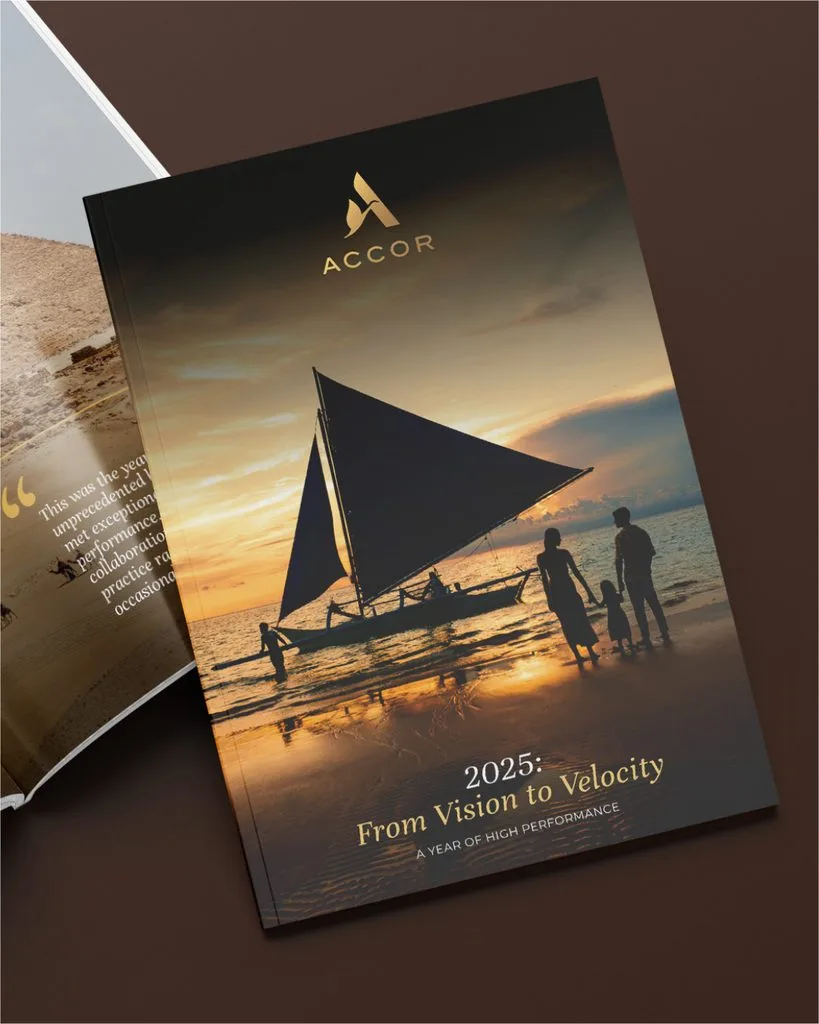
For Accor’s MEA APAC annual reviews, a travel magazine approach gave the content an appropriate visual setting. Photography sat alongside interviews, infographics and selected figures, helping bring together achievements from across a large region.
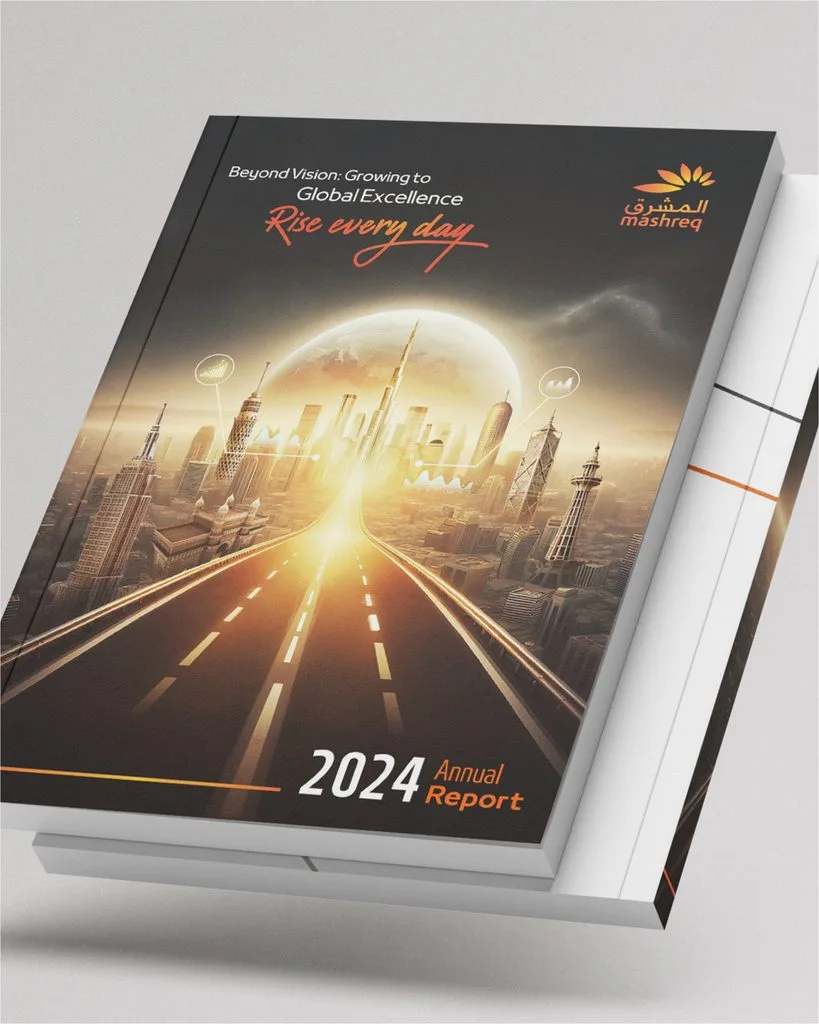
A financial report may call for a more restrained approach. In Mashreq’s 2024 Integrated Annual Report, we used a pared-back design that gave the data room on the page. The visual approach needs to suit both the organisation and what its readers need to understand.
Build consistency across the whole report
A report can draw on dozens of contributors. Without a shared design system, differences in their material quickly become differences in how the report communicates.
Consistent typography, chart styling and colour use help readers recognise patterns as they move through the document. If a colour identifies one business division, it should keep that meaning throughout. If key figures use a particular format, that format should be reliable.
English and Arabic editions need the same care. Arabic typography, reading direction and the space required by translated text should be considered from the outset. Each edition needs to feel natural to its reader, with the same information hierarchy and attention to detail.
Plan for how the report will be read
A spread that works in print may be difficult to read on a laptop or phone. Digital delivery needs decisions about navigation, text size and how readers reach the detail behind a headline figure.
Our digital adaptation of TAQA’s 2023 Annual Report developed key sections into dedicated web pages, using navigation and interactive elements to help people explore the information. Planning those formats early gives the design team more room to make the content work in each setting.
Before your next report goes into design, ask what readers should understand from its key pages. Then look at whether the proposed visuals help them get there. That is a useful starting point for a creative brief.
Our Strategic Approach to Annual Reports:
As a specialist annual report design agency in Dubai, we specialise in turning annual reports into powerful brand assets. Our team combines strategic thinking, sharp editorial skills, and standout design to create reports that not only meet compliance standards but elevate your brand story. Whether it’s crafting a compelling narrative, designing a clean and engaging layout, or building interactive digital formats, we bring clarity, creativity, and consistency to every page. We’ve worked with listed companies, government entities, and fast-growing brands - so we know how to balance data, design, and deadlines to deliver reports that resonate with stakeholders and stand out for all the right reasons.
Ready to start your annual report? Get in touch with our team today.